Lesson 1 - Fronts, Highs, Lows
Highs and lows refer to relative pressure gradients, often showed on contour maps called synoptic charts:
 These tend to take place on the surface, as opposed to higher in the atmosphere. Historically, these were first delivered by horse, then later by telegraph - now by internet.
The light blue barbs indicate the direction wind is coming from - barb tail length indicates speed.
The solid red contours indicate regions of constant surface sea level pressure.
In the northern hemisphere, air flows:
- Clockwise (anti-cyclonic) around a high
- Counterclockwise (cyclonic) around a low
Highs are generally associated with calm weather, lows with clouds and stormy weather.
Weather fronts, introduced during WWII indicate regions of active change in pressure.
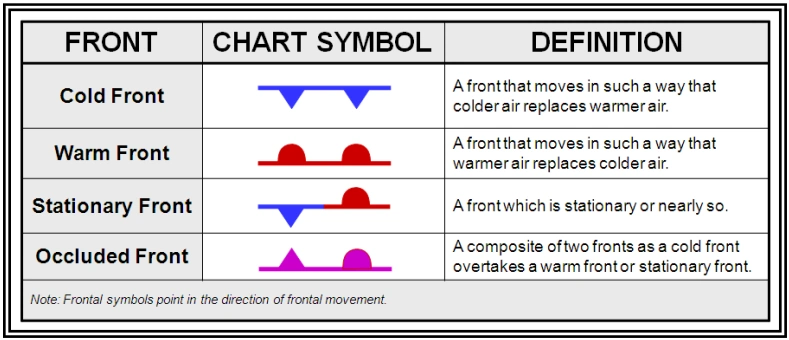
Fronts tend to be in low-pressure troughs.
Time
Meteorologists (like astronomers) use UTC (also known as GMT or Z) as a baseline time zone. or if in PDT.
In the United States, daylight savings time starts the second Sunday of March and lasts to the first Sunday in November, and transitions at local midnight.
Weather station models
Weather station models will generally take the form of this chart:
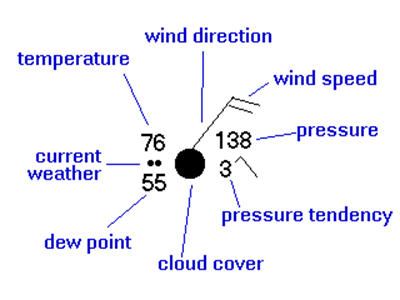
Generally, these models won't be independent entities or charts, but might be seen in surface plots (or synoptic charts) such as shown at the start of this page.